


 44 / 66

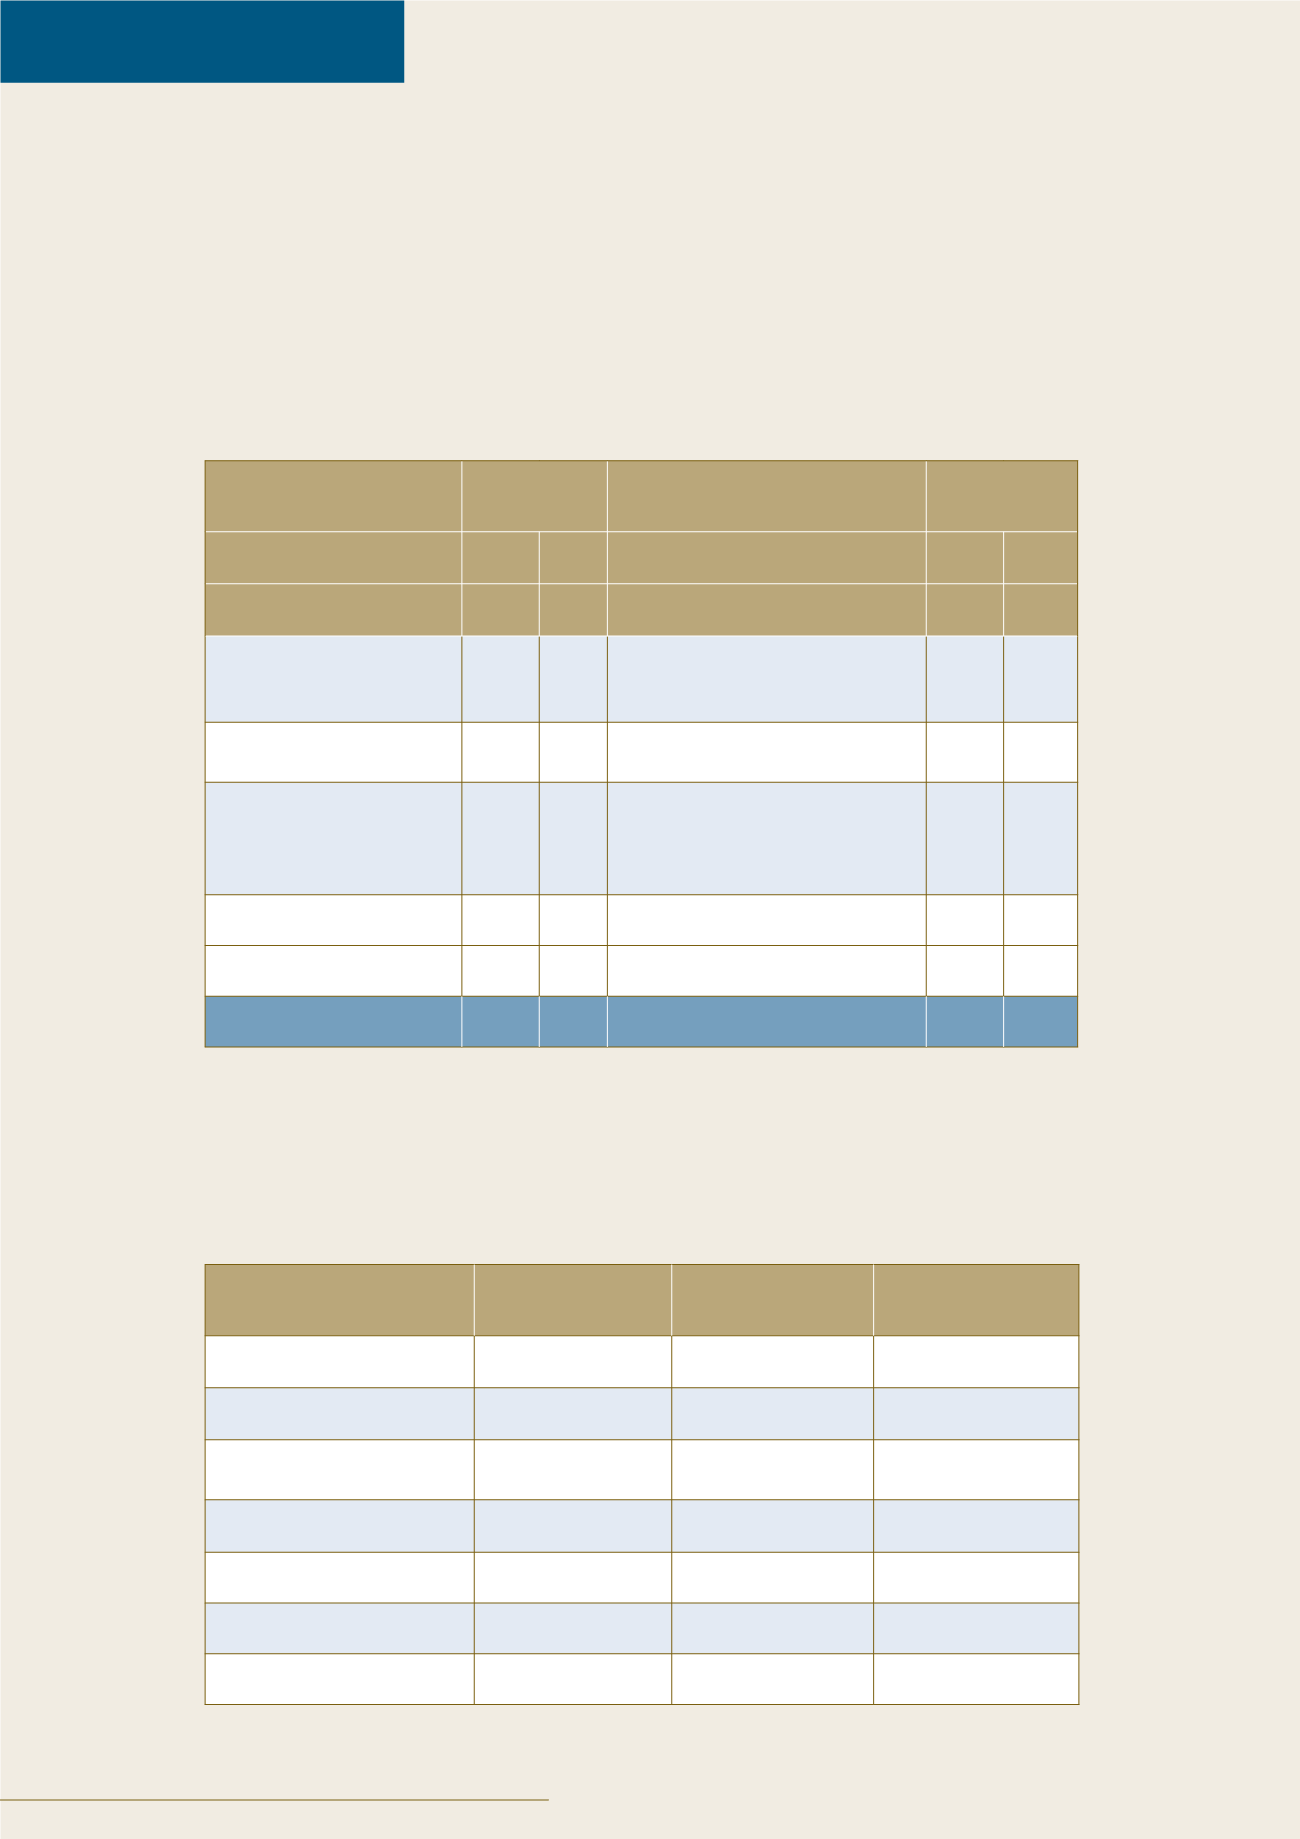
At 31 March
At 31 March
Assets
2017 2016 Liabilities
2017 2016
£’bn £’bn
£’bn £’bn
Money market assets,
due from banks and
building societies
34.5 48.4 Deposits due to banks and
building societies**
10.6 11.3
Loans, advances and
assets leased*
7.5 8.3
Deposits due to customers
31.0 43.9
Investments
0.9 0.7
Other deposits (held as
security and interest payable)
including deposits due to
public sector bodies
0.3 0.4
Other assets
0.4 0.5
Other liabilities
0.4 0.4
Capital and Reserves
1.0 1.9
Total assets
43.3 57.9 Total liabilities
43.3 57.9
Country
31 March 2017 31 March 2016
31 March 2015
Isle of Man
35%
25%
25%
United Kingdom
29%
41%
41%
European Union
(excluding UK)
6%
6%
6%
Europe (Non-EU)
2%
2%
5%
Middle and Far East
7%
6%
6%
North America
4%
4%
4%
Other
17%
16%
13%
APPENDIX D
42 • Isle of Man Financial Services Authority Annual Report 2016/17
ASSETS AND L IABI L I T I ES OF L ICENSED BANKS
The data includes figures relating to overseas branches of Isle of Man incorporated banks. At
March 2016 the data included the business of the Jersey and Guernsey branches of Barclays
Private Clients International Limited (an Isle of Man company); this bank transferred all of its
business in the Isle of Man, Jersey and Guernsey to branches of Barclays Bank PLC in each island
in October 2016 and surrendered its licence. Therefore, the data at March 2017 only includes
the Isle of Man business of Barclays Bank PLC.
GEOGRAPHICAL SOURCE OF NON-BANK DEPOS I TS
* At 31 March 2017, 51.3% of loans, advances and assets leased were classified as being secured on residential property
(31 March 2016: 61.0%). The above figures relating to loans and advances are net of impairment charges.
** Includes deposits/loans received from other Isle of Man banks of £2.01bn (2016: £3.35bn).